Financial Value

WHAT DID WE ACHIEVE TOGETHER?
Deliver solid financial results as a result of the implementation of our strategy.
819.2 billion
pesos in consolidated
revenue
11.0%
consolidated net
income growth
Download chapter

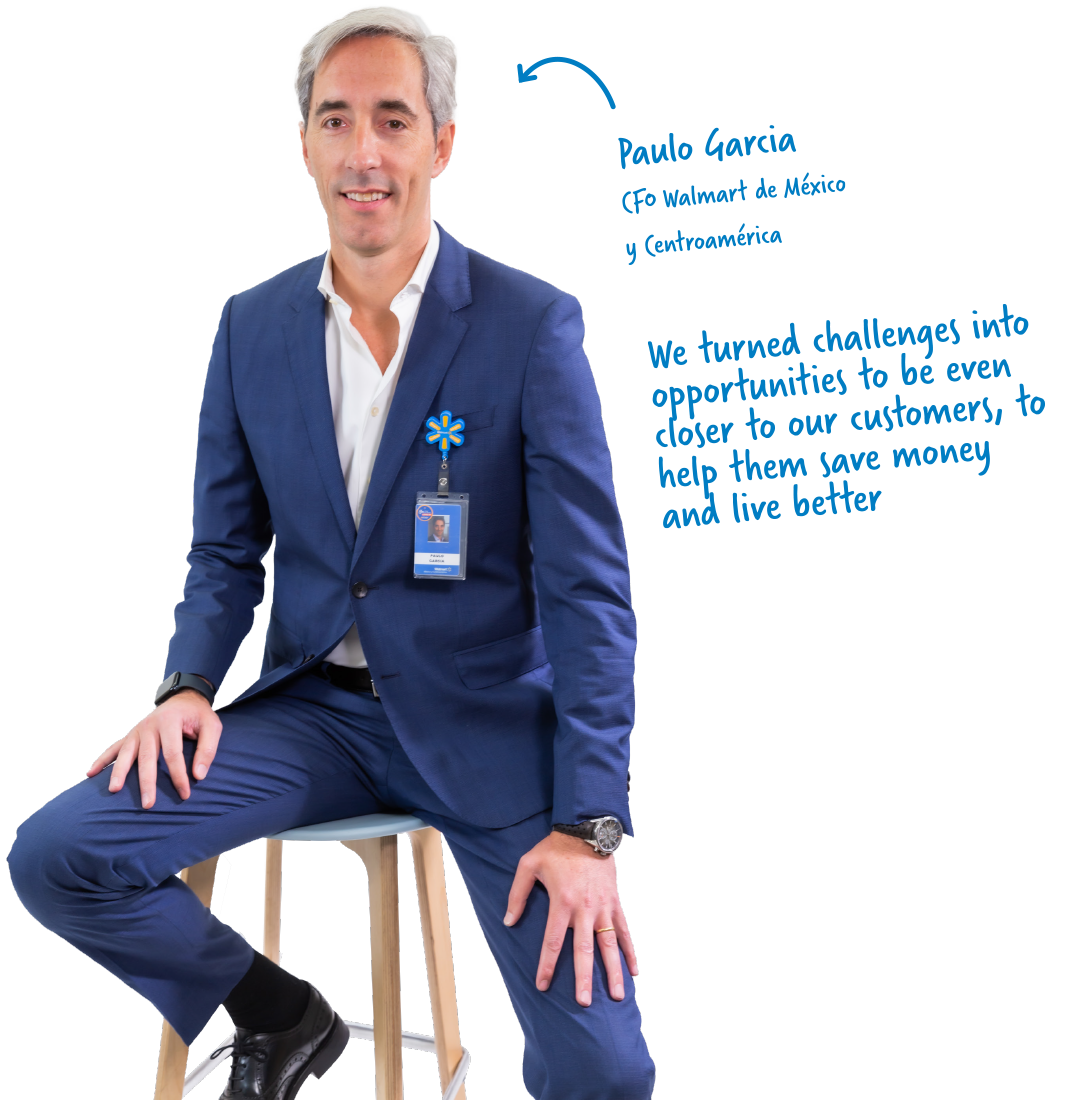
MESSAGE OF THE CFO WALMART DE MÉXICO
Y CENTROAMÉRICA

2022 was a dynamic year in which we managed once again to overcome the challenges presented to us and the inflationary environment in which we were immersed, demonstrating our resilience and ability to innovate.
Our financial strength allows us to continue to move steadily forward on the path of implementing our long-term strategy and we are very proud of our results
They reflect the work of our associates, and we want to thank them for making a difference.

PERFORMANCE

Our financial discipline drives growth at Walmart de México y Centroamérica
Download complete
information
Results by country, geographic area,
format and division
10.3%
Same-store sales growth Mexico
12.9%
Same-store sales growth Central America
Geographic
area
South
Central
North
Metropolitan area
Format
Division
Supermarket
General Merchandise
Apparel
Country
Nicaragua
Costa Rica
Honduras
El Salvador
Guatemala
We continued to deliver solid growth in Mexico. we have been growing

for 9 consecutive years above the formal market as measured by ANTAD.
Growth gap in same-store sales Walmex1 vs ANTAD
self-service stores and clubs
Basis points
40
2014
210
2015
330
2016
160
2017
350
2018
90
2019
130
2020
200
2021
10
2022
We continued to deliver solid growth in Mexico. we have been growing

for 9 consecutive years above the formal market as measured by ANTAD.
Basis points
TRANSACTIONS
MILLIION
2022
2021
2020
2019
2018
2,147
2,016
1,973
2,287
2,229
TOTAL REVENUES
MXN BILLIONS
2022
2021
2020
2019
2018
819.2
736.0
701.7
646.8
616.9
OPERATING INCOME
MXN BILLIONS
2022
2021
2020
2019
2018
68.0
62.9
57.4
54.0
51.6*
EBITDA
MXN BILLIONS
2022
2021
2020
2019
2018
87.4
81.2
75.4
71.0
67.1*
INVESTMENT IN FIXED ASSETS
MXN BILLIONS
2022
2021
2020
2019
2018
21.3
20.5
16.7
20.6
17.9


ROIC**%
2022
2021
2020
2019
2018
20.24
20.20
17.24
20.77
20.60

CASH GENERATION
MXN BILLIONS

2022
2021
2020
2019
2018
79.8
72.8
64.8
63.7
60.5
DIVIDEND PAID
MXN BILLIONS / MXN PER SHARE
 Dividend per share
2022
2021
2020
2019
2018
29.6
28.2
30.9
36.0
25.6

NUMBER OF

ASSOCIATES
2022
2021
2020
2019
2018
233,594
231,259
231,271
238,972
234,431

TOTAL

UNITS
2022
2021
2020
2019
2018
3,745
3,620
3,489
3,407
3,249
DOWNLOAD INDICATORS 2022
** In order to provide the investors community a better view of the underlying performance of our business, we are including a retroactive estimation of the effect the adoption of the IFRS 16 would have had on 2018 financial results.
These pro-forma 2018 figures are not audited, but are based on the 2018 audited reported results and adjusted with our best estimates to show the effects related to the adoption of the IFRS 16.
**Source: Bloomberg
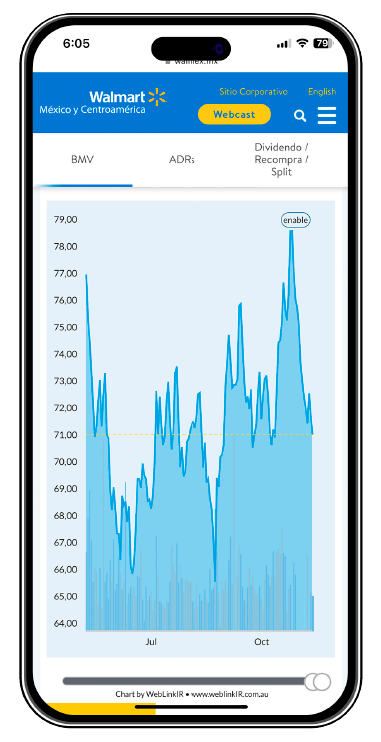
CREATING VALUE

Record high price per share
march 31st 2022
For the seventh consecutive year, we reached a new all-time high in our stock price, standing at 81.92 pesos
Download complete
information
Record high share price
2022
81.92
2021
78.78
2020
60.10
2019
59.04
2018
57.86
2017
48.19
2016
47.22

INVESTMENTS

We continued to invest strategically and to strengthen our capabilities to position our company for continued growth
21.3 billion
pesos invested in strategic projects
Download
complete information

INCOME STATEMENT
AND BALANCE SHEET

At December 31, 2022
Download
complete information
BALANCE SHEET (MXN Billions)
Assets
47.4
Cash
89.5
Inventories
281.9
Fixed Assets and Others
Assets Liabilities and Equity
98.9
Accounts Payable
319.9
Equity and Others
Total
418.8